Ethereum Q2'23: State of the Network
10Q filling for Ethereum
“Ethereum’s total fees grew 56% quarter-on-quarter driving a 187% increase in net income and accelerating the burn to 0.8% of token supply outstanding from 0.3%. The Shapella upgrade was successfully implemented without an ETH selloff. Ethereum’s operating metrics continue to decelerate, while metrics for the Ethereum Ecosystem (including L2s) are growing.”
If Ethereum had a quarterly earnings release, that would be the leading quote. This article serves as Ethereum’s unofficial Q2’23 results. It captures, comments and dissects:
Ethereum’s Operating Metrics
Ethereum’s Ecosystem (consolidating L2 metrics)
Ethereum’s Income Statement
Key implications
The biggest topic in Q2’23 was US regulation. To understand the latest on US regulatory front read SEC Drops the Hammer: Making sense of the SEC cases against Binance and Coinbase.
Brought to you by artemis.xyz
I use Artemis for my data needs. With easy formulas it allows me to quickly pull on chain data into Excel and Google Sheets. It saves me hours. Plus is has an easy to use dashboard. Give it a try!
Operating Metrics Q2’23

Daily active users: Declined 3% year-on-year (“yoy”), an improvement over the ~10% declines experienced in Q1’23 and Q4’22. Sequentially the deceleration continues. Q1’23 declined 4% quarter-on-quarter (“qoq”). In the first few days of July the average DAUs are down 12% compared to Q2’23. A decline in DAUs means there are fewer people using Ethereum on a daily basis.
Average daily transactions: Declined 4% yoy. The deceleration has slowed compared to the prior two quarters. Sequentially average daily transactions are nearly stabilizing at -1% qoq. The decline in average daily transactions is due to fewer daily active users. The average transactions / daily active users remains constant around 3 transactions per day. Average daily transactions are trending down in the first week of July.
ETH staked: 17% of ETH supply is staked. The amount of ETH staked increased 58% yoy and grew 13% qoq. Sequentially the growth in ETH staked has decelerated.
The Shapella upgrade was successfully executed on April 12, 2023. ETH did not experience a selloff post Shapella as some had incorrectly feared. Ethereum Q1'23: State of the Network explains why a selloff would not happen.
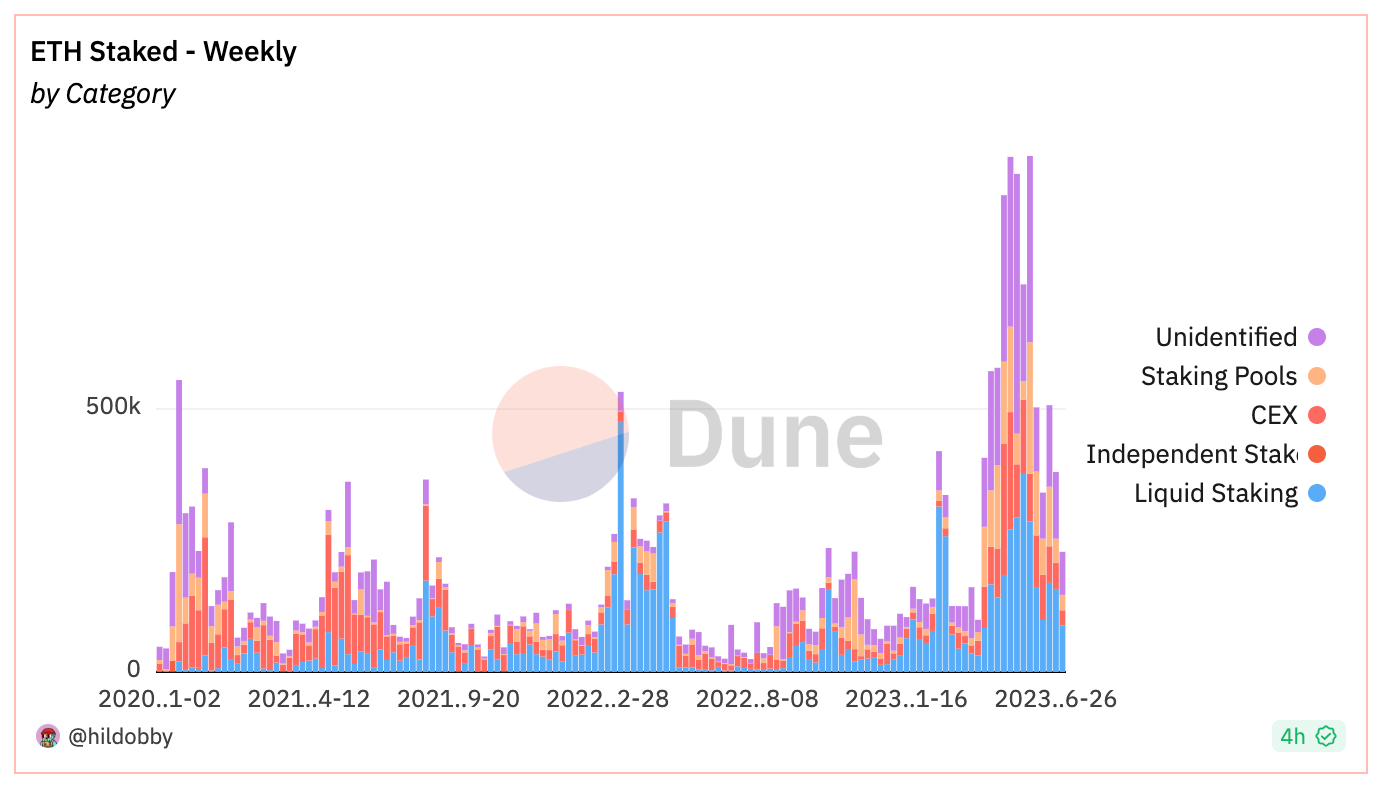
The amount of ETH staked continues to grow. But the pace of growth has decelerated. In the lead up and subsequent to Shapella the weekly amount of incremental ETH staked has declined (see chart below). Approximately 1.8 million ETH was staked in April, 4 million in May and 2.2 million in June.
Prices: ETH is +55% year to date and +4% on the quarter. ETH was volatile inter-quarter. ETH dropped 22% peak to trough in the quarter then rebounded.
TVL: in ETH declined 41% yoy. The decline deteriorated even as the stronger comps were lapped. Sequentially TVL declined -14% in line with the Q1’23 decline.
Ethereum Ecosystem
Ethereum’s health is increasingly assessed by the state of the Ethereum Ecosystem. The Ethereum Ecosystem comprises of its Layer 2 rollups. Arbitrum, Optimism, Polygon zkEVM, StarkNet and zkSync Era are used to determine the health of Ethereum’s L2s. Activity has migrated to L2s. They offer cheaper and faster transaction settlements. Assessing Ethereum’s Ecosystem, consisting of activity at the Ethereum base layer and L2 layer, paints a different picture. Daily Active Users (“DAU”) and Average Daily Transactions are growing across the Ethereum Ecosystem.

DAU growth on Ethereum has been stagnant since 2021. The number of DAUs across the Ethereum Ecosystem has roughly doubled from 400,000 to 800,000 in the last year (see chart above). However, growth in DAUs across the Ethereum Ecosystem does not necessarily mean there are more people interacting in the Ethereum Ecosystem. The more likely explanation is that a subset of Ethereum DAUs have also become DAUs of Ethereum L2s.
Polygon PoS figures are not included in the Ethereum Ecosystem. Polygon PoS is an Ethereum sidechain. Polygon PoS users may in time migrate to the Polygon zkEVM chain. Polygon’s focus is its zkEVM chain. The migration could be a boon for The Ethereum Ecosystem. There are 360,000 DAUs on Polygon PoS, which is more than Ethereum’s 300,000 DAUs. Ethereum’s DAUs would not double on the migration. A significant number of Polygon PoS DAUs are likely also Ethereum DAUs.
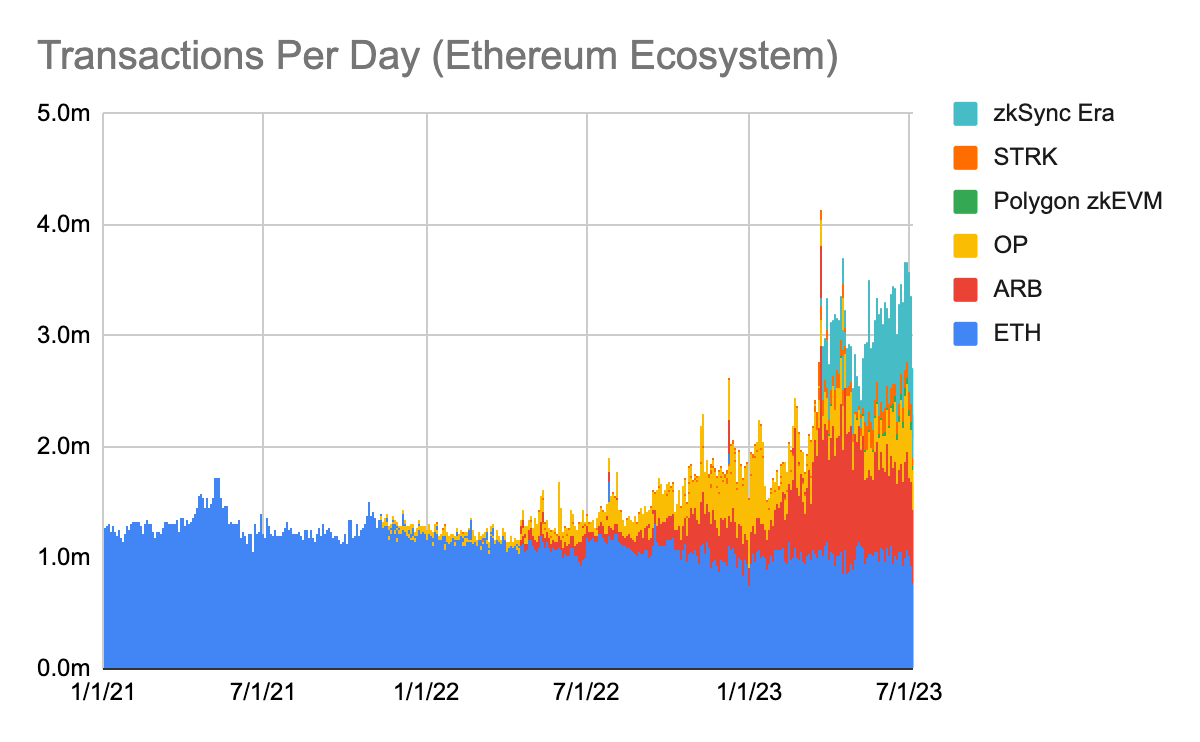
DAUs across the Ethereum Ecosystem are transacting more with the advent of L2s. The average number of daily transactions on Ethereum has hovered around 1 million since the second half of 2020. Ethereum transactions are capped at about 1 million per day. L2s have collectively added an additional 2 million average transactions per day. Total transactions on the Ethereum Ecosystem have nearly tripled in the last year (see chart below). For every 1 transaction on Ethereum, there are 2 transactions on L2s.

Polygon’s PoS chain averages 2.4 million transactions per day. If those transactions migrated to Polygon zkEVM chain or another Ethereum L2, it would nearly double the number of daily transactions in the Ethereum Ecosystem.
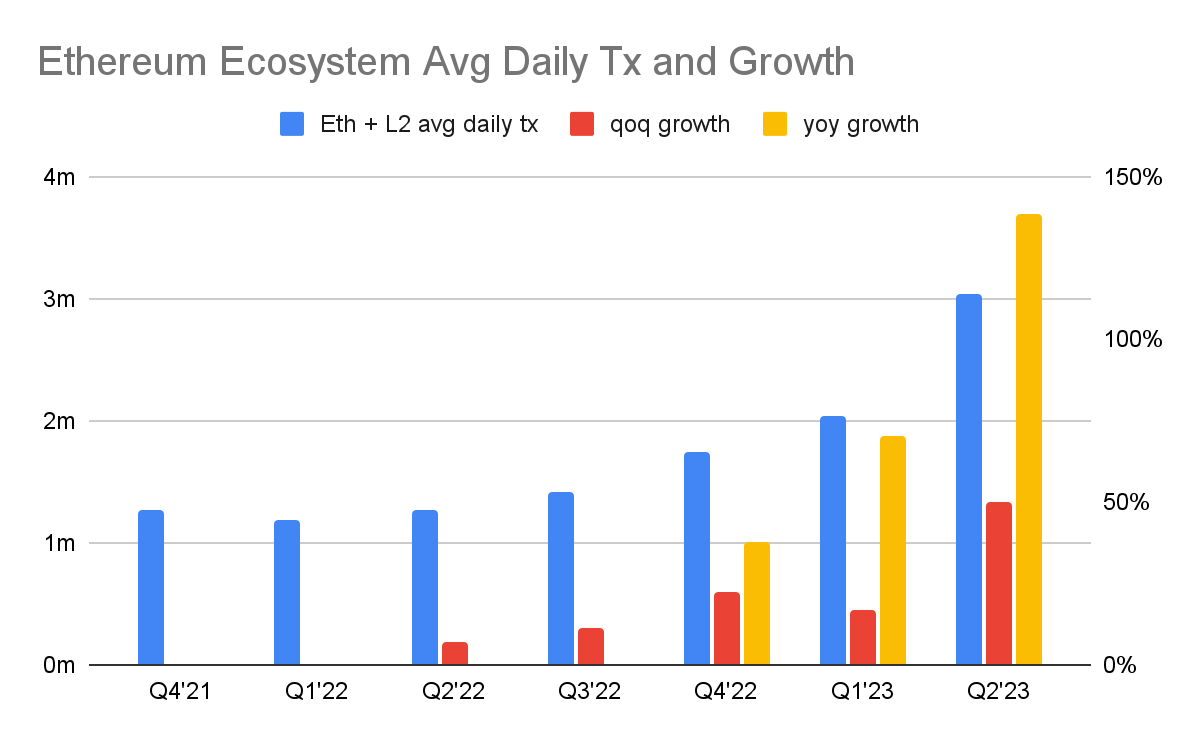
Average daily transactions across the Ethereum Ecosystem reached 3 million in Q2’23, up from 2 million in Q1’23. The sequential growth in average daily transactions across the Ethereum Ecosystem accelerated to 50% qoq from 17% qoq growth in Q1’23. Average daily transactions across the Ethereum Ecosystem grew 139% yoy in Q2’23 (see chart below).

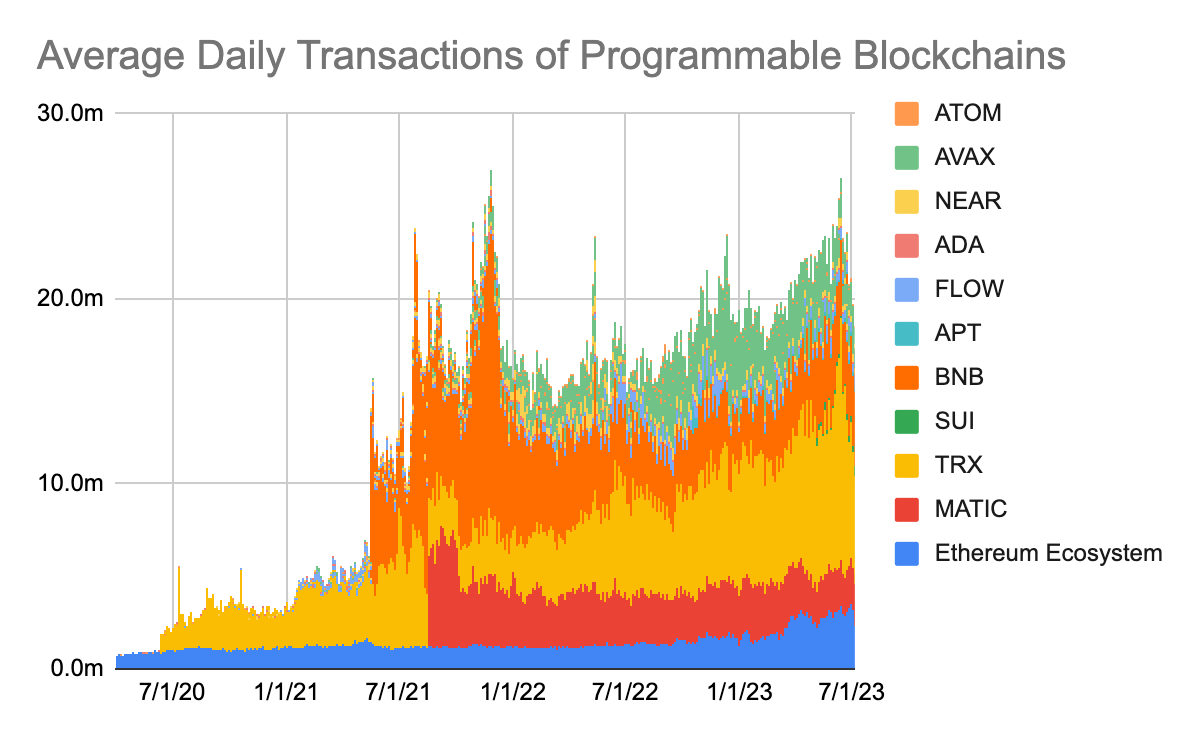
The 3 million of average daily transactions that occur on Ethereum Ecosystem represents 16% of total daily transactions on the most prominent programmable blockchains excluding Solana (see chart below). Solana’s transaction figures are not directly comparable to other chains. Solana executes 20 million transactions per day. It is arguably one of the most performant blockchains. However, since its transaction throughput is so high and fees low, a large portion of its transactions are spam.
The Ethereum Ecosystem share of total transactions would double to roughly 30% if Polygon PoS were included. The Ethereum Ecosystem has a 60% market share of daily transactions excluding BNB and Tron. BNB and Tron differ greatly from the other blockchains in the group. They are more centralized.

Ethereum Income Statement

Total fees: Declined 17% yoy driven by a 13% reduction in transaction fees and 4% lower transaction volumes. Total fees grew 56% sequentially. The sequential growth was driven by fees/transaction increasing 57%, while transaction volumes declining 1%. Total fees represent the sum cost paid by users to process all the transactions posted to Ethereum. In tradfi parlance, it’s the total revenue generated by the ‘company’.
Gross profit: A gross profit margin of 84% in the quarter means that 84% of total fees generated were burned. Gross profit is often referred to as ‘network revenues.’ It captures the portion of total fees that accrue to token holders. Gross profit grew sequentially in line with total fees.
Daily fees and gross profit (a.k.a. revenue) tripled in May (see chart below). The spike was driven by meme-coin mania popularized by Pepe. Fees and gross profit (a.k.a. revenue) subsequently returned to normalized levels. Barring another one-off fee driver, fees should decline sequentially in Q3’22. Average daily fees are down 27% in the first week of July compared to the average daily fee in Q2’23.

Net income: Net income increased nearly 3x sequentially. The growth in net income is due to a 56% qoq growth in total fees. The sequential growth in net income exemplifies Ethereum’s operating leverage. Ethereum’s costs do not grow in line with total fees. Total fee grew 56% qoq, yet Ethereum’s fixed cost, its cost of issuing tokens to validators, declined 5% qoq. As a result, net income grew 187% qoq.
Ethereum has been profitable each quarter since PoS was introduced. The dramatic profit improvement is driven by a 90% decline in the cost of issuing tokens.
Tokens outstanding: Ethereum burned more tokens than it issued in Q2’23. Tokens outstanding declined from 120.45 million to 120.22 million. Net token issuance (calculated as annualized net tokens issued divided by beginning balance) has declined from low single digit percentage to -0.8%. Ethereum increased the number of tokens outstanding by ~3% in 2022. Now it reduces the number of tokens outstanding by ~1%.
How to interpret Ethereum’s income statement?
Total fees represent the amount paid by users to have their transactions posted to the Ethereum blockchain. Total fees comprise of the base fee and tip. The tip is a pass through expense. It is paid to validators. Note the tip fee line item is the same number as the fee paid to validators expense line item. It is a variable cost. It grows in proportion to usage. Users pay a tip fee to have their transactions prioritized.
The base fee is paid by users to process transactions. Note the base fee number is the same as the gross profit figure. Gross profit indicates how much money (denominated in ETH) the Ethereum blockchain makes for the transactions it processed. It is sometimes referred to as ‘network revenue’. The gross profit margin represents how much of total Ethereum fees are burned. Burned tokens are removed from circulation. It’s similar to a share buyback.
Cost of issuing tokens is the expense paid to validators to keep the network secure. It's a fixed cost. It does not increase proportionally to usage.
Net income is the difference between gross profit (ie base fee) and new token issuance. Ethereum’s net income of 227,147 ETH in Q2’23 means it collected 227,147 more in base fees than it issued in new tokens. As a result, Ethereum’s tokens outstanding was reduced by 227,147.
The more net income Ethereum generates, the more ETH is burned, the fewer tokens there are outstanding. The fewer tokens are outstanding, all else being equal, the more valuable each token is.
So what?
1. Q2 surge was short lived
The spike in total fees and resulting increase in token burn in Q2 was short lived. It was driven by a one-off event; meme coin mania. The surge lasted about two weeks. Expect Q3’23 to compare poorly sequentially.
2. It’s all about the L2s
Ethereum Ecosystem operating metrics, which include L2s, show a healthy growing network. Ethereum standalone operating metrics, by comparison, indicate a stagnating network. Ethereum’s growth is driven by L2s. Their success is critical to Ethereum. The upcoming EIP-4844 implementation will have a material impact on L2s and Ethereum. Read The Dankest EIP: what EIP-4844 is and what's misunderstood.
The only way to grow Ethereum fees in the near term is by inflating fees/transaction - i.e. higher gas price. Ethereum daily transactions currently max out around 1 million per day. The thinking is that L2 transactions will grow dramatically. L2 transactions are batched together into one input on the Ethereum base layer. The cost of one expensive Ethereum transaction is split amongst many L2 transaction fee payers.
3. The amount of ETH staked is slowing
The amount of ETH staked ran up in advance of and immediately after Shapella’s successful implementation. The decelerating trends suggests that the amount of ETH staked may not grow to +50% as quickly as previously perceived. An incremental 40 million ETH needs to be staked to achieve a 50% staking ratio. At the current rate of ~1 million additional ETH staked per month, it would take 40 months or 3 and ⅓ years to reach 50% staking.
That’s not necessarily a bad thing as an ETH staker. The lower the staking ratio, the larger the staking rewards paid to validators, and hence, the higher the all-in ETH yield. The all-in ETH yield is the sum of the staking, earnings and MEV yield and token supply inflation or deflation. The most economically attractive scenario is a low staking ratio, hence a high staking yield, and high fees, hence high earnings yield. The least economically attractive scenario is the opposite. The economic lens is not the only parameter that drives ETH value. The higher the staking ratio, the more secure the blockchain, which, in theory, leads to a higher ETH value.
The decelerating amount of ETH staked has led to the underperformance of Lido and Rocket Pool. LDO and RPL are down 17% and 18% respectively in the quarter while ETH is flat. The slowing amount of ETH staked coupled with smaller Rocket Pool mini pools means there are fewer RPL buyers. Read The Case for LSD: Liquid Staking Derivatives to better understand this dynamic.
4. Ethereum’s operating leverage leads to a big burn
Ethereum’s profitability and burn mechanism is a big deal. Ethereum has shifted from $22 million per day of sell pressure, at a $1,860 ETH price, to $5 million per day of buy demand; a $28 million delta. The $28 million swing represents 4.5% of Ethereum’s market cap.
There were two economic problems with Ethereum’s PoW model. First, Ethereum used to issue 17,000 tokens a day to miners. That’s 5% annual dilution. Second, an estimated 70% of those tokens were immediately sold to fund costly mining operations. At a $1,860 ETH price, the token issuance to miners and subsequent selling led to $22 million of daily sell pressure.
The combination of switch to PoS and the introduction of the burn mechanism, converted the $22 million a day sell pressure to a $5 million daily buy pressure. Ethereum now burns (i.e. buys back) $5 million worth of tokens every day, whereas it used to sell $22 million of ETH tokens daily. The table below outlines the pro forma income statement from PoW to PoS.

Most people misunderstand Ethereum’s operating leverage. Operating leverage is tradfi speak for an asset whose profits grow at a much higher rate than its revenues. Profits grow dramatically because operating costs don’t grow while revenues do. Technologists generally don’t understand operating leverage. Tradfi investors don’t understand crypto.
The ‘Forecast’ column in the chart above exemplifies Ethereum’s operating leverage. The Forecast column assumes total fees increase by 5x. A 5x growth in fees, leads to a 9.9x growth in net income. Ethereum’s fixed operating costs, the cost of issuing tokens to validators, doesn’t increase when total fees increase. The net result is a 9.9x increase in Ethereum’s deflation rate. Ethereum reduces the number of tokens outstanding by 4.2% annually, when revenues increase by 5x, compared to the current 0.4% deflation rate. The buy demand increases 5.2x to $28 million per day from $5 million.
For prior Ethereum State of the Network reports see Q1’23, Q4’22, and Q3’22.
Stay curious.
Don’t forget to hit the “♡ Like” button!
♡ are a big deal. They serve as a proxy for new visitors and feed into Substack’s algorithm that distributes my articles to all Substack readers.
Better yet…share this article with your crypto community.
It’ll show how on the ball you are ;)
Follow me on Twitter @samuelmandrew for my latest takes.


Fantastic article, hope you continue doing these each quarter. subbed and shared
Ty my friend